A z-score tells us how many standard deviations away a given value is from the mean. The z-score of a given value is calculated as:
z-score = (x – μ) / σ
where:
- x: individual value
- μ: population mean
- σ: population standard deviation
This tutorial explains how to calculate z-scores in SPSS.
How to Calculate Z-Scores in SPSS
Suppose we have the following dataset that shows the annual income (in thousands) for 15 individuals:

To calculate the z-scores for each value in the dataset, click the Analyze tab, then Descriptive Statistics, then Descriptives:

In the new window that pops up, drag the variable income into the box labelled Variable(s). Make sure the box is checked next to Save standardized values as variables, then click OK.

Once you click OK, SPSS will produce a table of descriptive statistics for your dataset:

SPSS will also produce a new column of values that shows the z-score for each of the original values in your dataset:
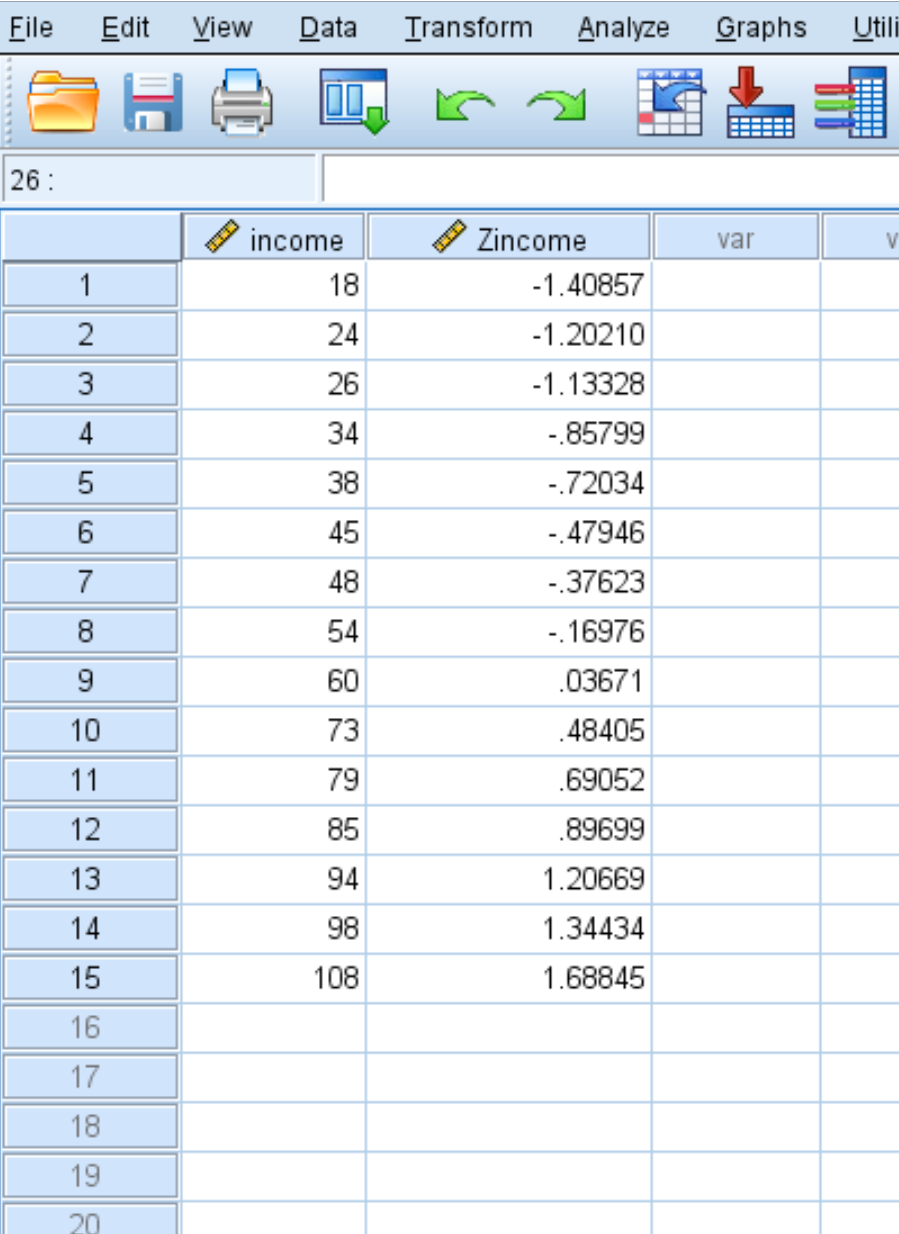
Each of the z-scores is calculated using the formula z = (x – μ) / σ
For example, the z-score for the income value of 18 is found to be:
z = (18 – 58.93) / 29.060 = -1.40857.
The z-scores for all other data values are calculated in the same manner.
How to Interpret Z-Scores
Recall that a z-score simply tells us how many standard deviations away a value is from the mean. A z-score can be positive, negative, or equal to zero:
- A positive z-score indicates that a particular value is greater than the mean.
- A negative z-score indicates that a particular value is less than the mean.
- A z-score of zero indicates that a particular value is equal to the mean.
In our example, we found that the mean was 58.93and the standard deviation was 29.060.
So, the first value in our dataset was 18, which had a z-score of (18 – 58.93) / 29.060 = -1.40857. This means that the value “18” is 1.40857 standard deviations below the mean.
Conversely, the last value in our data was 108, which had a z-score of (108 – 58.93) / 29.060 = 1.68845. This means that the value “108” is 1.68845 standard deviations above the mean.